Learning about the JEE Main 2026 marks vs percentile analysis is crucial to deriving a candidate’s rank. A JEE Main score of 250 can fetch 99.975034 to 99.977205 percentile, using the normalisation method.

Table of Contents
- What is the JEE Main Percentile Score?
- JEE Main Marks vs Percentile: Key Difference
- How are JEE Main Marks Converted to Percentile?
- JEE Main Marks vs Percentile (Expected Ranges)
- Steps to Calculate Expected Marks vs Percentile JEE 2026
- Percentile Required for NITs, IIITs, and GFTIs
- Factors Affecting JEE Mains 2026 Percentile vs Marks Calculation
- JEE Main Normalisation Procedure 2026
Comparing the JEE Main marks vs percentile 2026 helps students analyse their performance and anticipate their ranks in the most confined manner. The raw marks in JEE Main are converted into percentiles using a normalisation method to ensure fairness in the rankings, especially for calculating NTA scores regarding multisession papers.
For example, a JEE Main 2026 score of 170 can fetch a 99.431214 to 99.456939 percentile in the exam. Once the exam is concluded, the JEE Main 2026 results are released after converting the JEE Main marks into percentiles to analyze their performance and check their chances of getting admission to top engineering colleges in India.
To learn more about JEE Main 2026 marks vs percentile analysis, candidates can visit this page. They can also learn the normalisation steps to derive their percentiles based on their scores.
What is the JEE Main Percentile Score?
The JEE Main percentile score is not the percentage of marks scored by you. It shows how well you performed compared to other students in the same exam session.
The JEE Main percentile score is given on a scale of 0 to 100, with a higher percentile indicating good performance. It is calculated for the overall exam and individually for each subject, before adding them into a final score. The percentage and percentile are two different concepts. The percentage is of raw marks, whereas the percentile depicts how you have performed in comparison to other competitors appearing in the same session.
Read More: JEE Main Exam Dates 2026
JEE Main Marks vs Percentile: Key Difference
In the JEE Main exam, marks and percentiles are two different aspects. Marks are the score that you get in your JEE Main exam. For example, the JEE Main exam is of 300 marks, and if you scored 250 according to the marking scheme released by the authorities, the 250 will be your raw marks.
Whereas the percentile shows where you stand compared to other competitors who appeared for the exam. For example, 2 out of 10 candidates scored 250 marks in the JEE Main exam, but when it comes to their percentiles, they end up with slightly different percentiles. This happens because of some factors, like the difficulty of the exam in the same session. This happens because the percentile is adjusted through normalization to make the results fair across different sessions.
In short:
- Marks = Actual score in the exam.
- Percentile = Relative performance compared to peers, adjusted for session difficulty.
Check This: JEE Main 2026 Syllabus
How are JEE Main Marks Converted to Percentile?
To calculate the JEE Main percentile, a normalization process is followed by the authorities to convert marks into a percentile. The exam is conducted in multiple sessions, with different sets of questions and difficulty levels. Here, the normalization process ensures fairness.
The JEE Main Marks are converted into a percentile by following the steps:
- First, raw marks of candidates are calculated based on their answers.
- For each session, the relative performance of candidates is considered.
- The percentile is calculated using the formula:
Percentile = (Number of candidates who scored ≤ your score / Total number of candidates in that session) × 100 - Finally, after all sessions are completed, the highest percentile is fixed at 100, and other candidates’ percentiles are scaled accordingly.
Check This: JEE Main Mock Test
JEE Main Marks vs Percentile (Expected Ranges)
As per the previous year’s trends, the expected JEE Main marks vs percentile is as follows:
|
Marks Range |
Expected Percentile |
|
280 – 300 |
99.9 – 100 |
|
250 – 279 |
99.7 – 99.9 |
|
220 – 249 |
99.3 – 99.7 |
|
180 – 219 |
98 – 99.3 |
|
150 – 179 |
97 – 98 |
|
120 – 149 |
94 – 97 |
|
100 – 119 |
90 – 94 |
|
80 – 99 |
80 – 90 |
|
60 – 79 |
70 – 80 |
|
40 – 59 |
55 – 70 |
|
Below 40 |
Below 55 |
Steps to Calculate Expected Marks vs Percentile JEE 2026
The calculation of JEE Main 2026 expected marks vs percentile is important for students to convert their expected marks to the percentile. The pointers below explain the calculation of JEE Main 2026 marks vs percentile:
- Students have to divide the expected score by the total number assigned for converting marks to percentile JEE Mains 2026.
- The 100 marks in JEE Mains percentile 2026 need to be multiplied by the amount derived from the previous step to get the expected percentile for JEE Mains 2026.
Also Read: What is NTA Score in JEE Main Results 2026? Steps to Calculate
Percentile Required for NITs, IIITs, and GFTIs
For admission in top NITs, IIITs, and GFTIs, you need a higher percentile as the cutoff for these institutes goes higher. The approximate percentile requirements for different institutions are as follows:
|
Institute Type |
Percentile Required |
Notes |
|
Top NITs (NIT Trichy, NIT Surathkal, NIT Warangal) |
98+ for CSE and popular branches; 95–97 for other branches |
Marks usually around 180–200+ needed |
|
IIITs (IIIT Hyderabad, IIIT Delhi, IIIT Allahabad) |
97–99 for CSE; 94–96 for other branches |
Very competitive for top branches |
|
GFTIs (Government Funded Technical Institutes) |
90–95 for most branches |
CSE may require a higher percentile |
|
State Quotas (NITs) |
Lower than the All India cutoff |
Advantage for home state candidates |
Factors Affecting JEE Mains 2026 Percentile vs Marks Calculation
Students should review all the parameters under JEE Mains 2026 rank vs percentile before calculating the expected score. The factors considered for deriving the JEE mains percentile against the JEE Main marks in 2026 are explained in the following pointers:
- Total Number in the question paper
- Performance in the test
- Total Candidates
- Exam Difficulty
Also Read: JEE Main Precious Year Question Papers
JEE Main Normalisation Procedure 2026
The JEE Main Normalisation Procedure is employed by NTA to ensure the fairness of scores among the candidates. Since the JEE Main paper is conducted across several shifts, with each paper having a different level of difficulty, scoring the candidates becomes challenging.
The normalisation process standardises the calculation of ranks and marks candidates based on their relative performances. Here's how the JEE Main 2026 normalisation works:
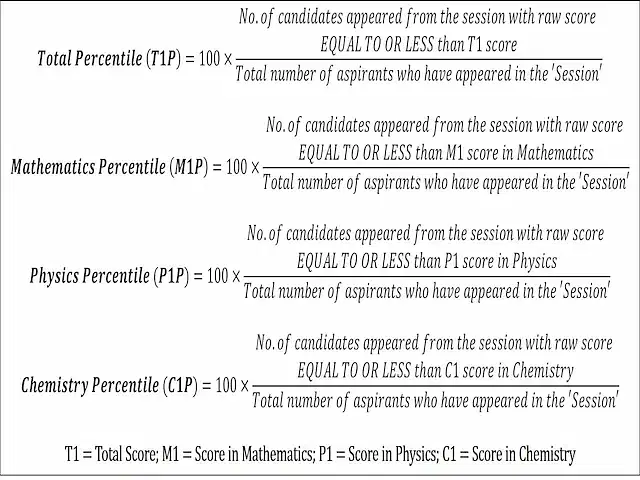
- Compiling the raw marks, the NTA utilises the percentile equivalence for the normalisation process (formula) across subjects - Physics, Chemistry, and Maths (PCM) as well as the total.
- Notably, the highest/top score from each session will carry the same ideal percentile of 100. The formula to drive the candidate-wise JEE Main percentile score is as follows:
|
100 x Number of candidates appeared in the "session" with raw score EQUAL TO OR LESS than the candidate |
- The JEE main percentile score indicates the percentage of candidates scoring equal to or below the target given percentile, which is determined after the normalisation process with the marks excelled by candidates.
- Those marks obtained between the highest and lowest scores are converted to proper percentiles. The percentile score will be used to create the JEE Main merit list.
Note: The Percentile of the total shall NOT be an aggregate or average of the Percentile of the individual subject. The Percentile Score is not similar to the Percentage of Marks achieved.
Also Read: Understanding JEE Main Normalization Process and its Effect on Scores
To get the marks vs percentile for any candidate, you first need to understand the difference between the JEE Main marks and percentile. Marks reflect your raw performance, while the percentile shows your relative performance compared to other candidates after normalization. As per the previous year’s trends, scoring above 200 marks generally guarantees a percentile of 98+ and opens doors to top NITs and IIITs. So, prepare aiming for better marks and percentile to get into top institutes like IIITs, NITs, and GFTI.


POST YOUR COMMENT