Placements & Internships :
There are no placements at Perunthalaivar Kamarajar Institute of Engineering and Technology.
Entrance Exams & Admissions :
The eligibility criteria for joining Perunthalaivar Kamarajar Institute of E
Placements & Internships :
There are no placements at Perunthalaivar Kamarajar Institute of Engineering and Technology.
Entrance Exams & Admissions :
The eligibility criteria for joining Perunthalaivar Kamarajar Institute of Engineering and Technology is passing the 12th in science stream in physics, chemistry, and maths.
Fees & Scholarships :
Course fee in Perunthalaivar Kamarajar Institute of Engineering and Technology is Rs. 17000 per year.
There is no scholarship for the students only sc. caste students getting a scholarship.
I am an OBC caste student so I am not getting a scholarship.
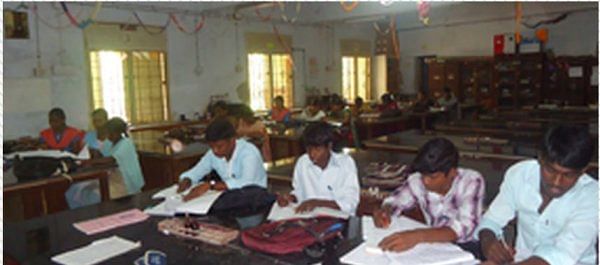
Academics & Faculty :
College starts at 9 am and ends at 5 pm in Perunthalaivar Kamarajar Institute of Engineering and Technology.
Teaching is nice but they are teaching only Tamil.
My college is nice overall.
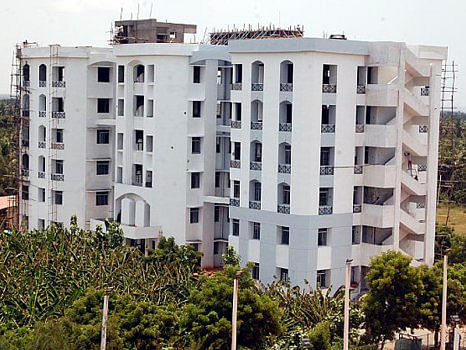
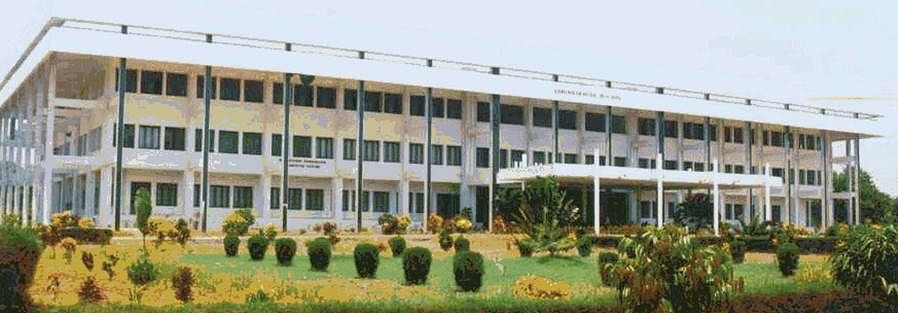
College Infrastructure & Hostel Facilities :
There are two hostels one is for girls and one is for boys at Perunthalaivar Kamarajar Institute of Engineering and Technology.
The fees are Rs. 17,000 per year and Rs. 3,500 per month for food.
There is no infrastructure to our college but faculty is nice.
There is no wifi.
Clubs & Associations :
There is no student society in Perunthalaivar Kamarajar Institute of Engineering and Technology.
Sports day and all festivals are celebrated in the college.
My college is nice.